

Over the past year, we’ve continued to see technology products and services evolve with business objectives – such as the need to improve the customer experience, improve internal processes, and generate new revenue systems – and IT leaders review these new technologies to ensure they are properly supporting their business.
More specifically, it’s been the year of AI. Whether it be building AI/machine learning models in-house or using AI-enabled technologies that already exist, IT decision-makers have been tasked with researching how to incorporate aspects of AI into their organizations. With all the various types, use cases, and ethical implications associated with implementing AI, this is no easy feat.
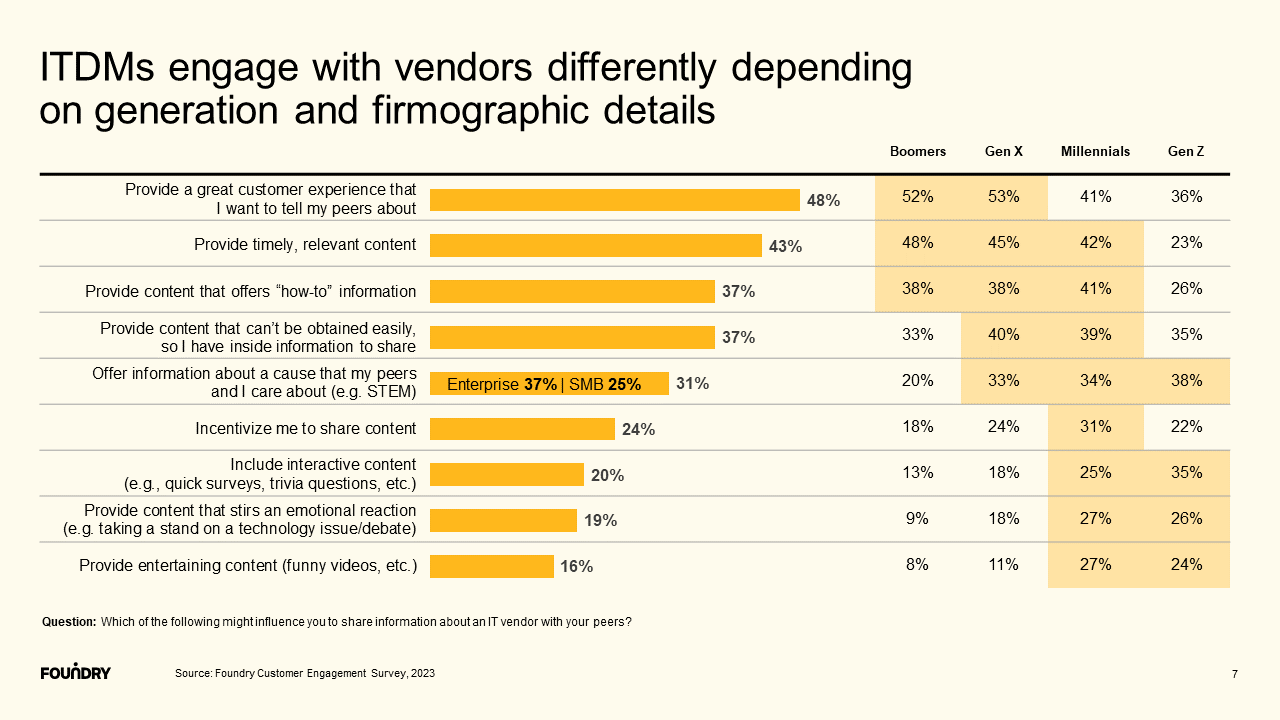
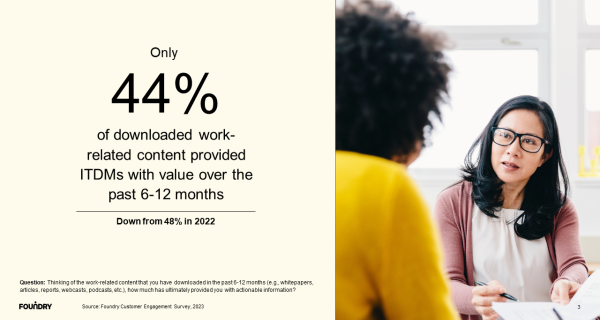
To recommend and provide appropriate solutions to their organization, IT decision-makers consistently need relevant resources, and technology marketers need to understand what these relied upon resources are. To help tech marketers gain clarity into what to create and how to connect with tech buyers during this process and ensure the content they provide is of value, Foundry recently surveyed over 800 global tech decision-makers in the 10th annual Customer Engagement study. This research provides insight into the various types of content ITDMs consume throughout the purchase process, and their engagement preferences when it comes to vendor follow-up, advertising, and maintaining relationships.
Key takeaways:
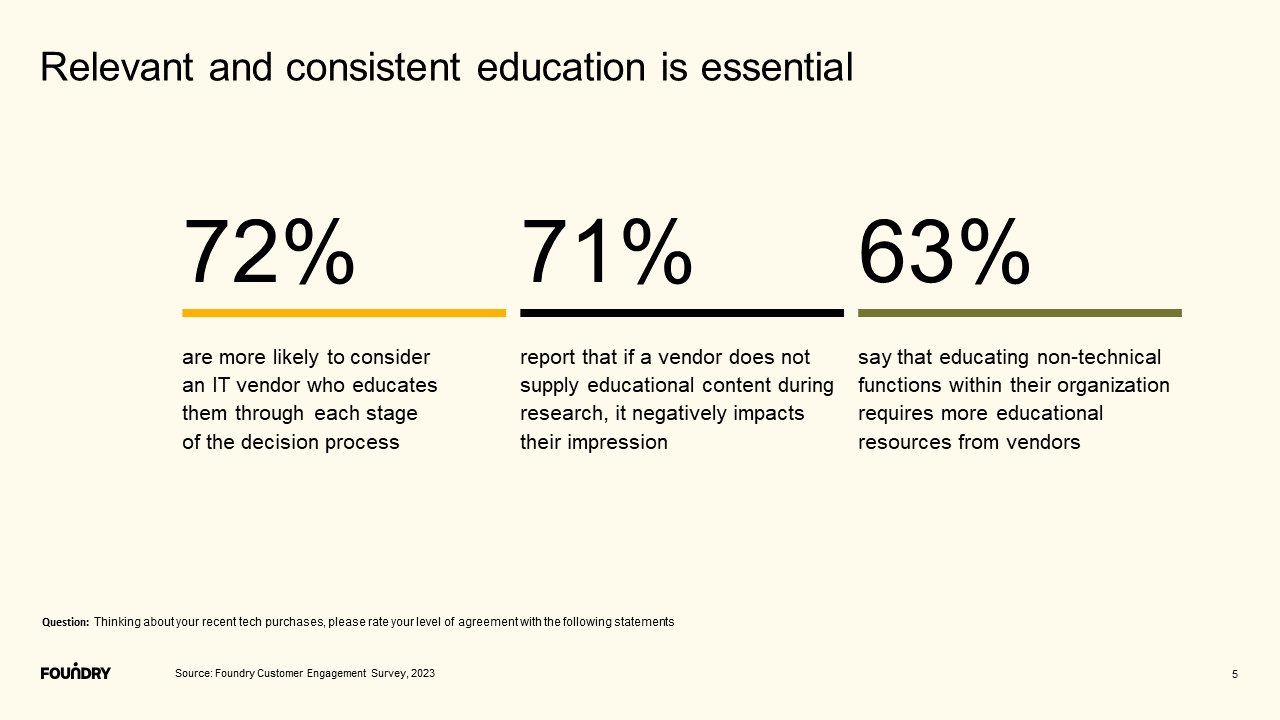
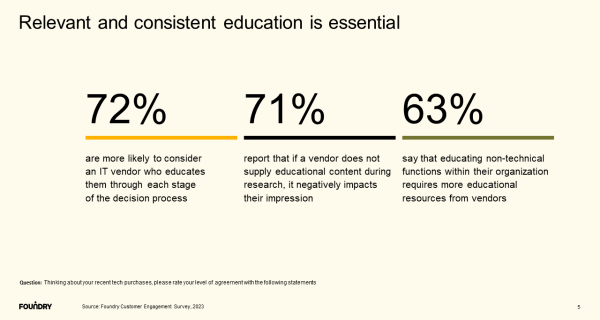
- Relevant and consistent content is essential – 73% are more likely to consider an IT vendor who educates them through each stage of the decision process.
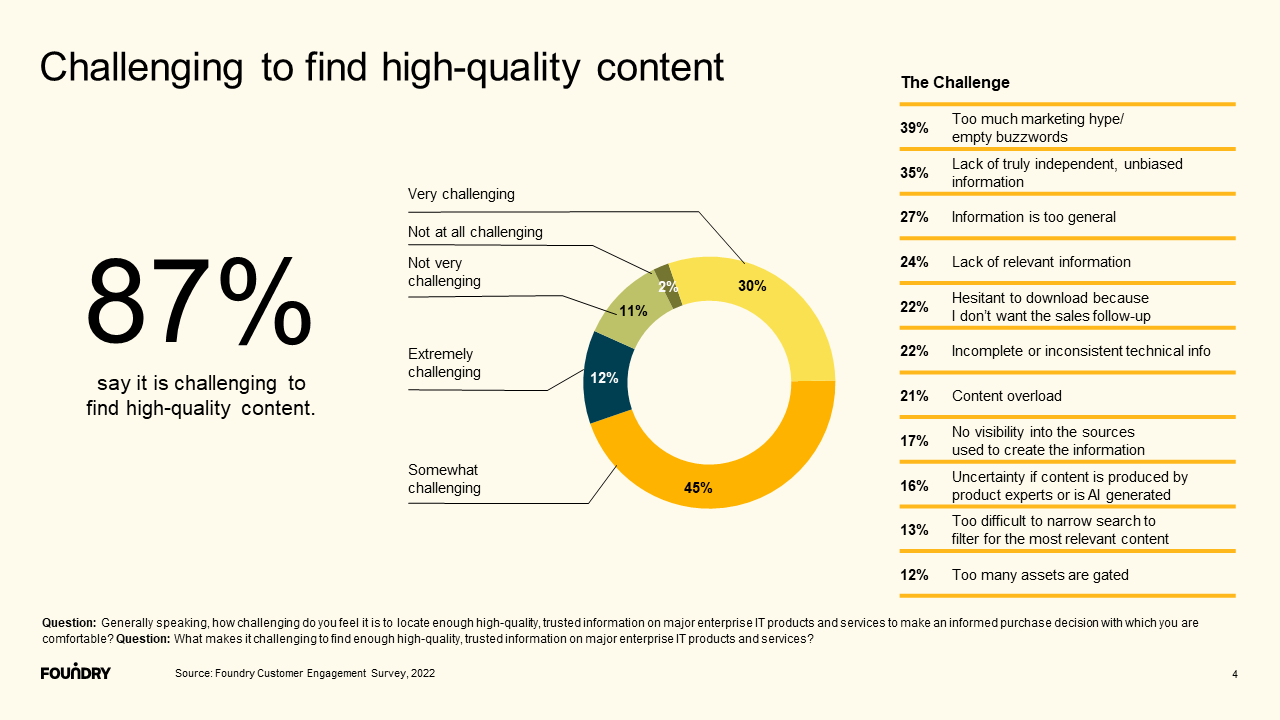
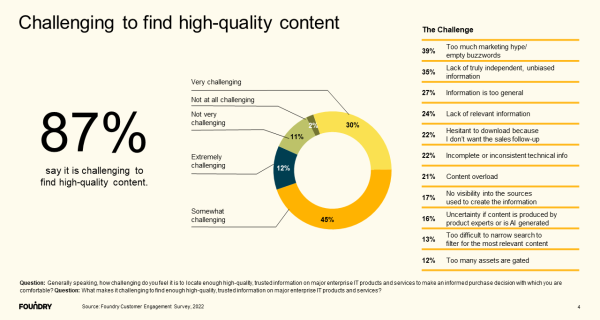
- IT decision-makers are still challenged to find high-quality content, with the main reasons being too much marketing hype/buzzwords and lack of truly independent, unbiased information. Uncertainty if content is produced by a product expert or if it is AI generated does not top the list, likely because ITDMs are familiar with what AI is capable of doing.
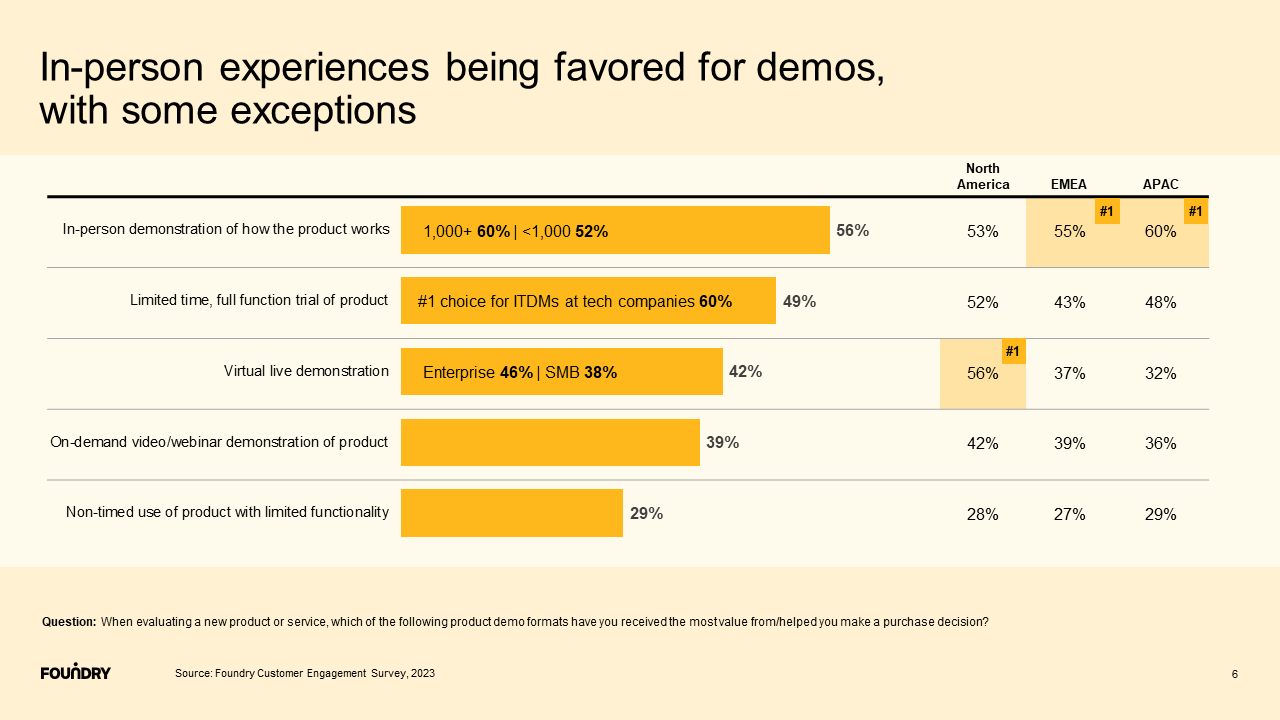
- Product testing/reviews/opinions, product demos/product literature, and technology news continue to be the top relied upon content types throughout the tech purchase process. Presentation of content is also important, as 74% of ITDMs say that they are more likely to engage with a variety of content if it is presented in an organized experience.
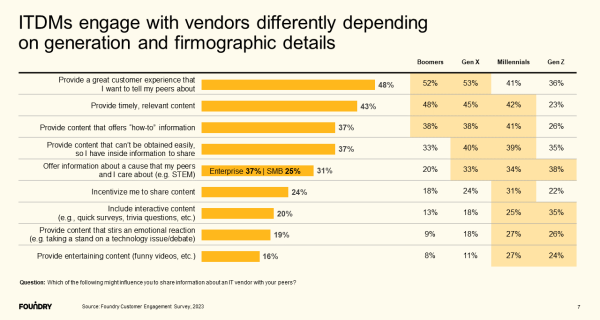
- Have a higher chance of gaining customers or receiving a response to outreach by understanding who their peers are. Close to ¾ of ITDMs say that they are more likely to respond to outreach from a tech vendor if they know their technology is already being used by a colleague or peer.
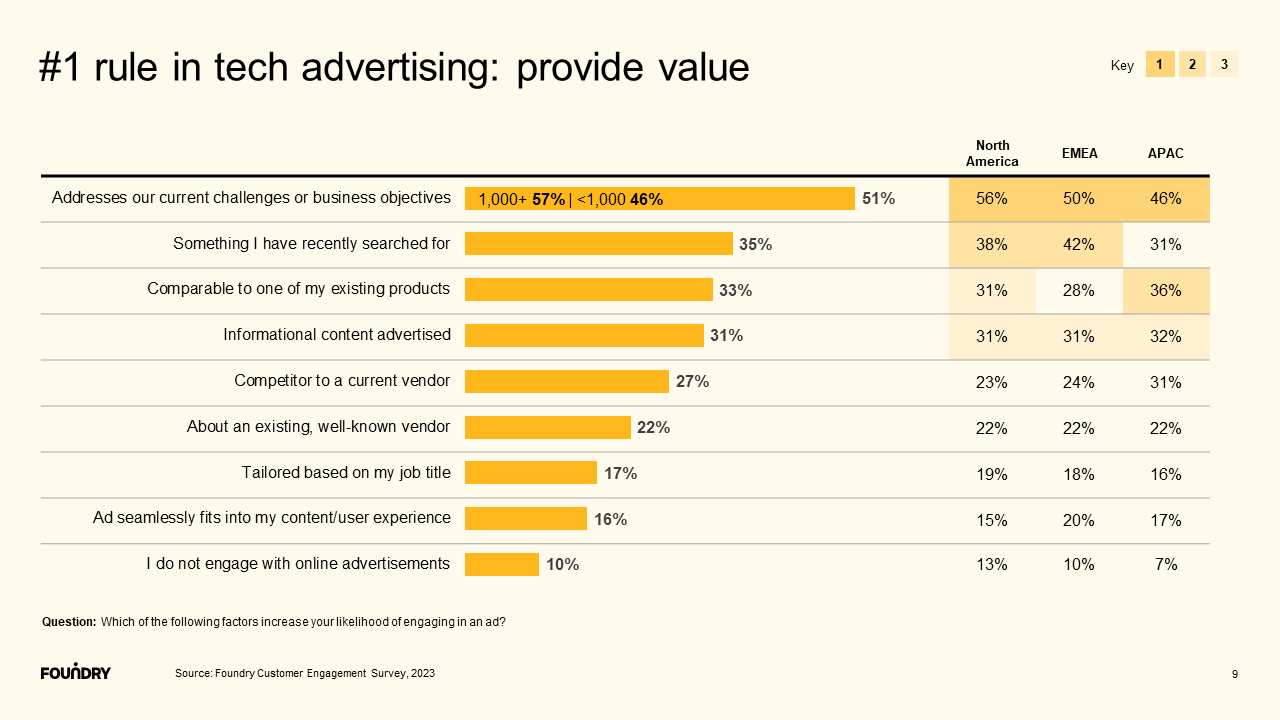
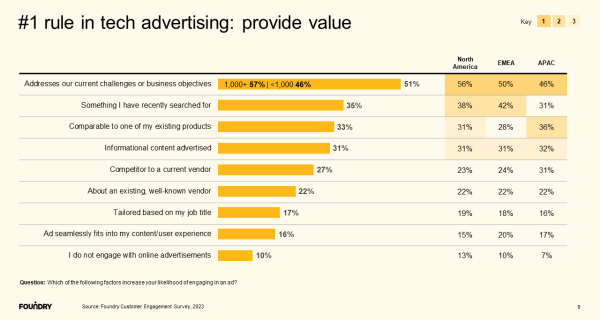
- The number one rule in tech advertising – provide value. The majority (90%) of ITDMs have engaged with online advertisements, with addressing current challenges or business objectives, or promoting something they have recently searched for, increasing the likelihood of engagement.
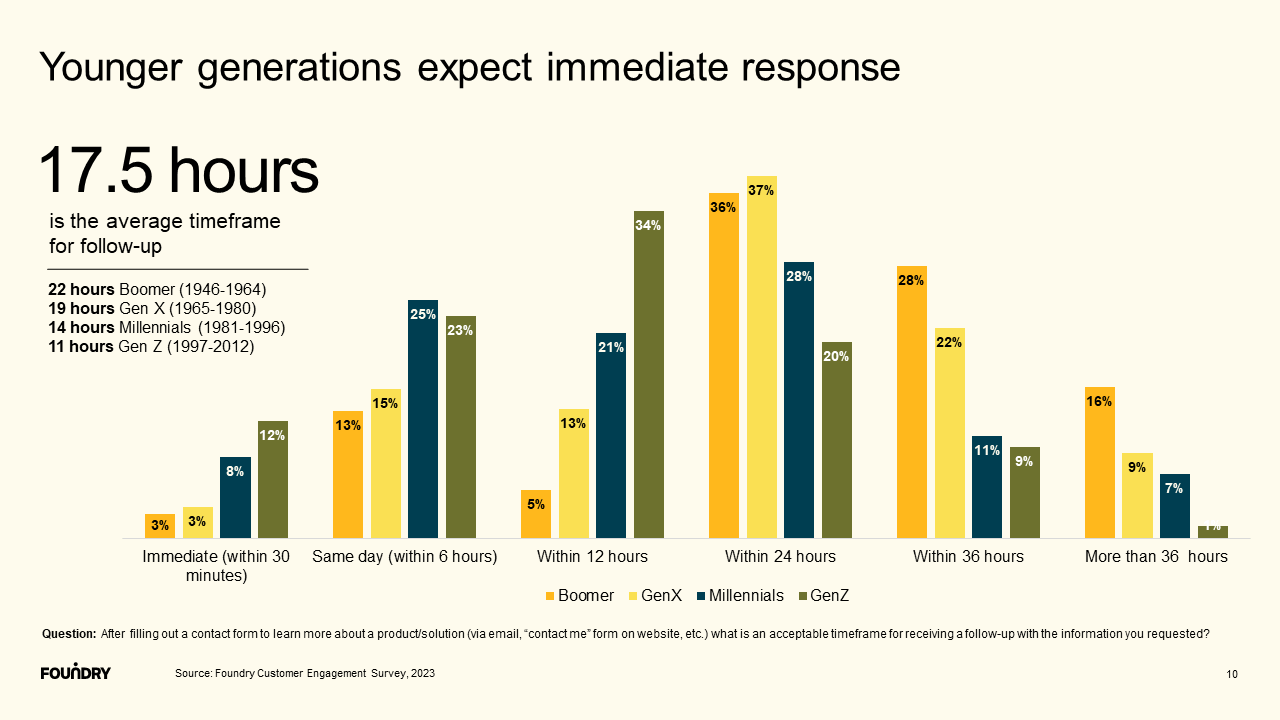
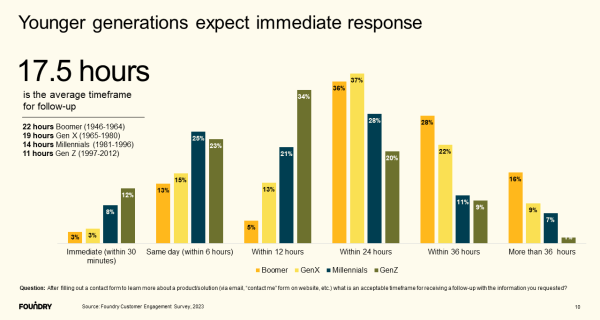
- Don’t miss the window – the average amount of time ITDMs think is an acceptable timeframe to receive sales follow-up after requesting information has expedited – 17.5 hours on average. This decreases to 11 hours for Gen Z and is 19 hours for Gen X.
The findings and trends in this report solidify the need that tech buyers have for consistent, valuable and trustworthy content. These individuals are tasked with researching, evaluating, and implementing new technologies while shifting organizational processes and require the appropriate educational resources and relationships to do so.
View the sample slides below for additional insight and download the full report to better understand and engage with tech buyers.
Click to enlarge
Additional buyer’s journey resources

White paper provides insight into the content types relied upon and vendor engagement preferences of ITDMs based on Customer Engagement.
Based on Foundry’s Role & Influence research, this report explores who’s involved in the tech purchase process and the information sources they rely on.
Guide helps marketers understand how to engage tech buyers with effective lead generation strategies, and how sales follow up impacts those efforts.
Research infographic
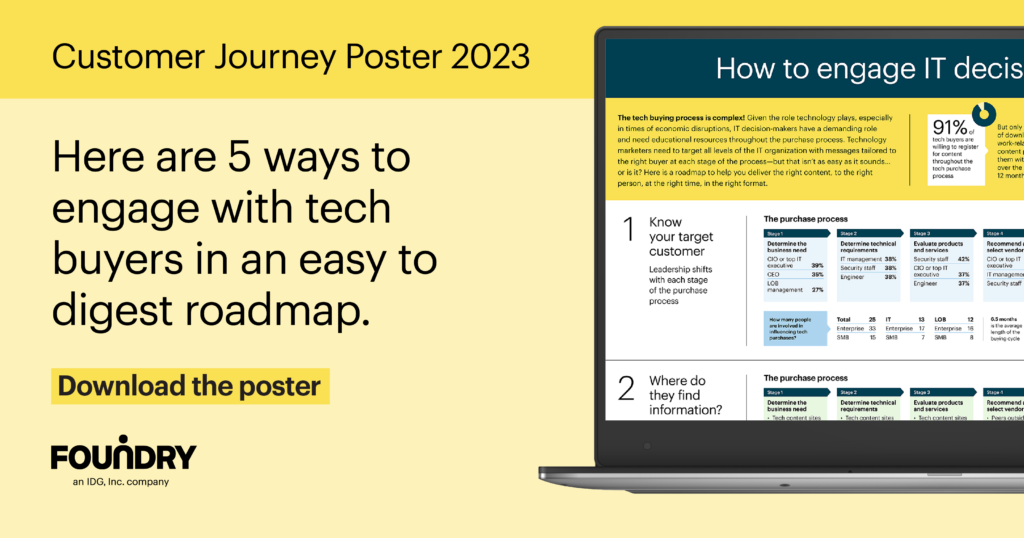
The tech buying process is complex! Technology marketers need to target all levels of the IT organization with messages tailored to the right buyer at each stage of the process. Here is a roadmap to help you deliver the right content, in the right format, to the right person, at the right time.
About the research
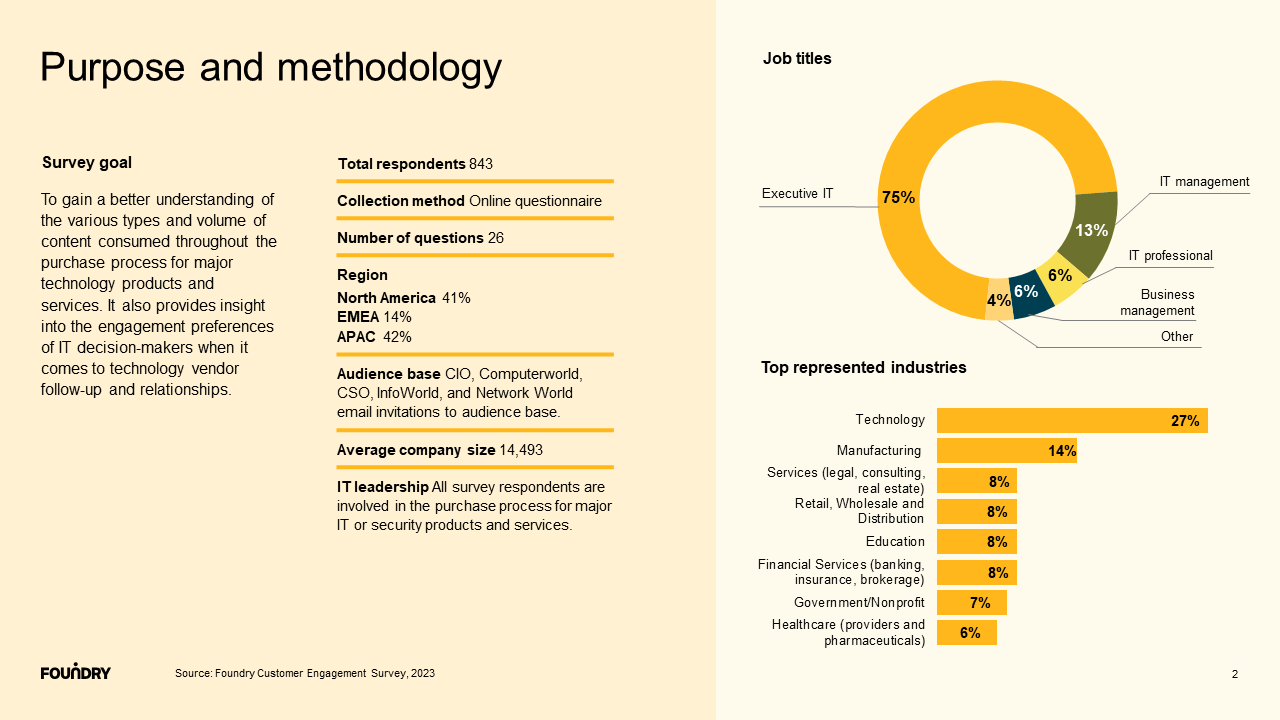
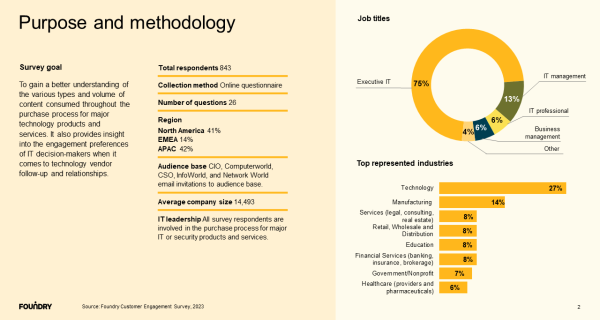
Foundry’s 10th annual Customer Engagement Study was conducted among the audience of 843 IT and business decision-makers. Foundry conducted this survey online throughout November 2023 to better understand the various types and volume of content consumed throughout the purchase process for major technology products and services. It also looks to gain insight into the preferences of IT decision-makers regarding IT vendor contact and follow-up during the purchase process. All respondents had IT or management titles, with 41% based in North America, 42% in Asia/Pacific (APAC) regions, and 14% from Europe/Middle East/Africa (EMEA).
Contact us to explore the results by company size, region, generation, and more differences.